The team with fewer wins is in first place. Standings pages pull this trick all the time: one club is 24-12, another is 27-18, and the 24-win team sits on top. The page is not broken — it is sorting by winning percentage, .667 against .600, because the clubs have played different numbers of games. Once you know the three numbers that run a standings page — percentage, the half-win tie convention, and games behind — the whole table turns into readable math.
Winning percentage: the base formula
With no ties involved, winning percentage is wins divided by games played: wins ÷ (wins + losses). A 24-10 team has played 34 games, so 24 ÷ 34 = 0.7059, displayed as .706 — the leading zero is dropped by convention. A .706 team wins about seven of every ten games, which is the entire meaning of the decimal: a rate, not a tally. The formula's whole job is putting teams on a common scale that stays comparable as the season lengthens, and it separates two questions that raw win counts blur together:
- 20 wins after 25 games is .800; the same 20 wins after 40 games is .500.
- Percentage answers: how often does this team win?
- Win totals only answer: how many games have been played?
Fewer wins, higher rank
Here is the opening paradox, worked out. Team A is 24-12; Team B is 27-18. A's percentage: 24 ÷ 36 = .667. B's: 27 ÷ 45 = .600. A ranks first with three fewer wins because six of B's extra games landed in the loss column. Games behind quantifies that gap with the standard formula, ((winsA − winsB) + (lossesB − lossesA)) ÷ 2: ((24 − 27) + (18 − 12)) ÷ 2 = (−3 + 6) ÷ 2 = 1.5, so B trails by 1.5 games. One table, two honest readings.
| Team | W-L | Win % | Games behind |
|---|---|---|---|
| A | 24-12 | .667 | — |
| B | 27-18 | .600 | 1.5 |
Games behind without the headache
The classic version of the formula uses two teams close in the table. Team A is 24-10, Team B is 22-12. Games behind = ((winsA − winsB) + (lossesB − lossesA)) ÷ 2 = ((24 − 22) + (12 − 10)) ÷ 2 = (2 + 2) ÷ 2 = 2, so B is 2 GB. The intuition for dividing by two: when B wins one game and A loses one, the gap closes by two games at once — one side gains while the other drops — so raw win-and-loss differences count each swing twice. A .500 team is always zero games behind itself, however long that took.
Ties count as half a win
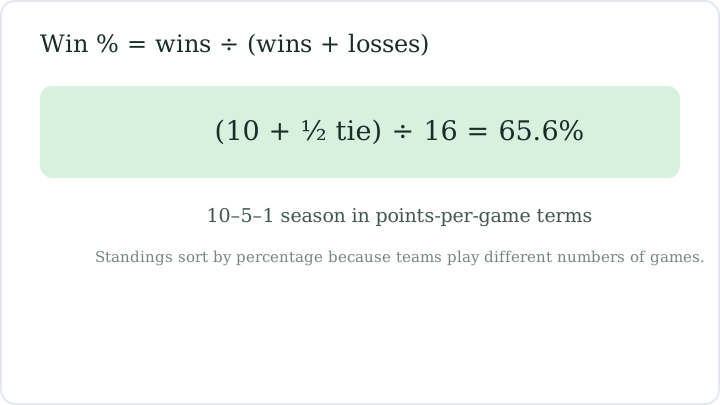
Leagues that allow ties report records like 10-5-1: ten wins, five losses, one tie. Many standings count the tie as half a win: (10 + 0.5) ÷ 16 = 10.5 ÷ 16 = 0.65625, displayed as .656 — a 65.6% winning rate. Note the denominator is total games played (16), because wins, losses, and ties together make up the schedule. Conventions vary by sport, which is why the header row matters:
- Football-style standings commonly use the half-win tie value.
- Hockey and soccer generally move to points systems instead.
- Overtime and shootout losses carry their own weights in some leagues.
Percent of possible points
When wins are not worth a fixed amount, standings switch to percent of possible points. In a soccer-style league awarding 3 points for a win and 1 for a draw, a team at 12-5-3 holds 12 × 3 + 5 × 1 = 41 points, out of 20 games × 3 = 60 possible, so 41 ÷ 60 = 68.3%. Points systems genuinely differ by league — hockey has historically used 2 points for a win with partial credit for certain losses, and formats keep evolving — so check the league's own points table before comparing across sports. The arithmetic is still part ÷ whole, just with points standing in for wins.
A taste of Pythagorean expectation
Analysts estimate what a team deserves, not just what it did, with the Pythagorean expectation: win% ≈ runs scored² ÷ (runs scored² + runs allowed²). A team scoring 5 runs a game and allowing 3 works out to 25 ÷ (25 + 9) = 25 ÷ 34 ≈ 73.5% — expect roughly a .735 team over time, whatever this week's record claims. Records sitting far above that line tend to drift back. Treat this as a teaser for a deeper idea: a standings page is a measurement, and every measurement runs on a formula you are allowed to inspect.
The systems side by side
One standings page can host several numbering systems at once, and knowing which is which stops most confusion. Winning percentage compares rates when schedules are uneven, which is why it does the sorting in baseball and basketball. Games behind measures raw distance in the win and loss columns. Points systems step in for sports where ties and overtime results carry different values. Read the column header first, apply the matching formula, and remember that each system answers a slightly different question about the same season.
| System | Formula | Best for | Watch out for |
|---|---|---|---|
| Winning percentage | Wins ÷ (wins + losses) | Uneven games played | Ties need the half-win rule |
| Half-win tie value | (Wins + 0.5 × ties) ÷ games | Records like 10-5-1 | Conventions vary by league |
| Games behind | ((winsA − winsB) + (lossesB − lossesA)) ÷ 2 | Distance between two teams | Comparisons across unequal schedules |
| Points percentage | Points ÷ possible points | Hockey and soccer tables | Points per win differ by league |
| Pythagorean expectation | Scored² ÷ (scored² + allowed²) | Estimating true strength | An estimate, not a standing |
Turn any wins-and-games-played pair into a decimal in one step with the percentage of a number calculator.
Open a calculator →Common questions
How is winning percentage calculated?
Divide wins by games played: wins ÷ (wins + losses). A 24-10 team sits at 24 ÷ 34 = .706. If the league counts ties, many standings add half a win per tie and divide by total games instead.
Why does a team with fewer wins rank higher?
Because it has played fewer games. A 24-12 team (.667) outranks a 27-18 team (.600) since a larger share of its games were wins. Standings sort by rate precisely so uneven schedules compare fairly.
How do you calculate games behind?
Take the wins difference, add the reversed losses difference, and halve: ((24 − 22) + (12 − 10)) ÷ 2 = 2. The halving exists because one win paired with one loss swings the gap by two games at once.
What is 10-5-1 as a winning percentage?
65.6%. Count the tie as half a win: (10 + 0.5) ÷ 16 = 10.5 ÷ 16 = 0.65625. The denominator is total games — wins plus losses plus ties.
Is .667 just two out of three?
Yes: 2 ÷ 3 = 0.6667, rounded to .667. That is why a 24-12 record shows .667 — 24 wins from 36 games reduces to exactly two of every three played.
What is Pythagorean expectation?
A formula that estimates winning percentage from scoring: scored² ÷ (scored² + allowed²). A team scoring 5 and allowing 3 per game lands near 25 ÷ 34 ≈ 73.5%, and records far above that mark usually drift back toward it.
Our team checks formulas against worked examples and reviews every guide for clarity before publication. Spotted an error? Tell us — our editorial policy explains how corrections work.