The headline says the risk jumps 50%, and the headline is technically true. The risk rose from 2 in 10,000 to 3 in 10,000 — one additional person per ten thousand, expressed as a relative change between two tiny numbers. Almost nothing in that sentence is a lie, and yet almost everything about it misleads. Percentages are the most compressible statistic we have: they erase the base, the sample size, and the denominator, leaving a clean number that feels like information. This is a mistakes clinic — five specific ways percentages get stretched, each with the arithmetic of the trick and the one question that defuses it.
Mistake one: relative change with no absolute numbers
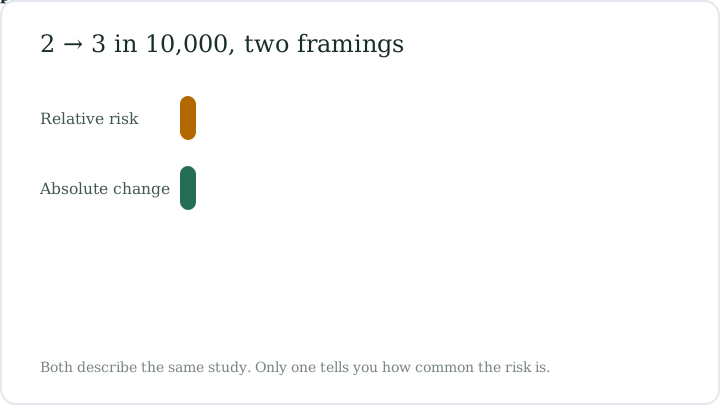
The classic move is reporting relative change on a small base. A risk going from 2 in 10,000 to 3 in 10,000 is +50% relative — the increase, 1, is half of 2. In absolute terms it is 0.02% rising to 0.03%, a change of 0.01 percentage points. Both statements describe the same facts; only one belongs in a headline with an exclamation mark. The fix is to demand both numbers. Any report that gives you +50% but not the underlying 2 and 3 is asking you to feel the ratio and skip the scale. Double a risk of 1 in a million and you still have a rounding error; double 30% and you have 60%.
- Relative: (3 − 2) ÷ 2 = +50%.
- Absolute: 0.03% − 0.02% = +0.01 percentage points.
- Ask always: changed from what, to what, out of how many?
Mistake two: tiny denominators dressed as trends
A startup blog posts that 75% of users switched from the competitor. The survey behind it has four people in it, three of whom said yes. The percentage is arithmetically correct — 3 ÷ 4 = 75% — and statistically meaningless, because with four respondents each person swings the number by 25 points. Had one answered differently, the claim collapses to 50%. Small denominators produce percentages that look like measurements but are really anecdotes with division performed on them. The fix: treat any percentage from a sample under a few dozen as a story, not a statistic, and look for the sample size before believing the headline number. Honest reports state n; press releases bury it.
Mistake three: the shrinking base
'Fastest-growing' is the favorite title of the smallest player in the market. A town of 200 residents that adds 100 is up 50% overnight; a city of a million must add 500,000 people to match the same percentage. Percentages measure change against a base, so a tiny base makes ordinary wobbles look like explosions — going from 2 customers to 3 is +50%, exactly as loud as doubling from 500,000 to 750,000. The fix is to convert back to raw counts before being impressed: ask how many units the growth actually was. Percentages from small bases are true but unweighted; they need the base printed next to them to mean anything.
- 2 customers → 3 is +50% relative, +1 customer absolute.
- The same +50% on 500,000 customers is +250,000 people.
- 'Fastest-growing' usually means 'smallest starting point' — ask for the counts.
Mistake four: percentage of what?
Every percentage divides something by something else, and the second something is where the hiding happens. Consider the shop sign '50% off the second item.' It sounds richer than '25% off both,' yet on two $40 items the first gives $40 + $20 = $60 and the second gives 2 × $30 = $60 — identical, because (1 + 0.5) ÷ 2 = 0.75, so the deal averages out to 25% off the pair. The first framing names a big percentage with a hidden denominator (only the cheaper item); the second names the honest average. Whenever a percentage impresses you, locate its denominator — of which total, applied to which items, counted from which starting value. Most tricks dissolve once the denominator is visible.
Mistake five: 'up to' and range framing
'Up to 70% off' requires exactly one item in the store to be discounted 70%. Every other item can sit at 5% — the claim stays true, because 'up to' marks a ceiling, not an average or a typical value. The same device powers broadband 'speeds up to 300 Mbps' and battery life 'up to 18 hours.' The arithmetic giveaway: a range's top end is a maximum, and maximums are the least likely value you will receive. The fix is to reframe every 'up to X' as 'at most X, possibly far less' and to ask for the typical or average value instead. When a sale sign or a spec sheet will not name the average, it has told you something anyway.
- 'Up to 70% off' is satisfied by one item at 70% and the rest at anything below it.
- Reframe as: at most 70%, possibly much less.
- Ask for the typical value; the gap between typical and 'up to' is the marketing.
Same facts, two framings
Nothing above requires the speaker to be lying — every misleading percentage in this clinic used true numbers. The difference between manipulation and honesty is which true numbers get printed. The table below restates each example both ways. Read the misleading column the way a headline writes it, then the honest column the way a friend would explain it over coffee. Same arithmetic, opposite impressions, and the only change is what the denominator was allowed to hide.
| Facts | Misleading framing | Honest framing |
|---|---|---|
| Risk: 2 to 3 per 10,000 | Risk jumps 50%! | Up 0.01 percentage points — one more case per 10,000 |
| Survey: 3 of 4 people switched | 75% of users switched | 3 out of 4 people asked — one person moves it 25 points |
| Customers: 2 to 3 | Customer base grows 50% | One additional customer |
| Sale: 50% off the second item | Get 50% off! | 25% off the pair — $60 either way on two $40 items |
| Discounts: one item 70%, rest 5% | Up to 70% off everything | Most items 5% off; the 70% applies to one item |
Before you share the next surprising percentage, run the before and after counts through the percentage change calculator and see which framing survives.
Open a calculator →Common questions
What is the difference between relative and absolute risk?
Relative risk compares two rates as a ratio; absolute risk states the difference in plain probability. Going from 2 in 10,000 to 3 in 10,000 is +50% relative but just +0.01 percentage points absolute. The relative number looks dramatic precisely because the base is tiny.
Why is 50% off the second item the same as 25% off both?
Because the full discount lands on only one of the two items, the average discount is (1 + 0.5) ÷ 2 = 0.75, or 25% off the pair. On two $40 items: $40 + $20 = $60 with the first deal, and 2 × $30 = $60 with the second.
How small a sample makes a percentage meaningless?
There is no hard line, but under a few dozen responses each person swings the total by several points — in a sample of 4, one person is 25 points. Treat such percentages as anecdotes, and look for the stated sample size before treating any claim as a trend.
What does 'up to 70% off' actually promise?
Only a ceiling. One discounted item at 70% satisfies the claim even if everything else is 5% off. Read 'up to X' as 'at most X' and ask for the typical discount, speed, or battery life — the number the seller chose not to print.
Why do small companies always sound fastest-growing?
Because percentage growth divides by a tiny base. Two customers becoming three is +50%, the same relative growth as 500,000 becoming 750,000. Convert the claim back to raw counts before being impressed — the base is doing the shouting.
What one question defuses a misleading percentage?
Percentage of what, out of how many? Name the denominator and the sample size, and the framing collapses: the 50% risk jump becomes one case per 10,000, and the 75% survey becomes three people. Almost every percentage trick hides in the base.
Our team checks formulas against worked examples and reviews every guide for clarity before publication. Spotted an error? Tell us — our editorial policy explains how corrections work.